在日常的 开发、 调试 过程中,总会遇到各种针对移动端的适配问题。
而移动端的大头,微信。
已经逐渐成为了很多项目的重要适配对象。作为一款国民级应用,他的调试却并不像普通浏览器那样开放。
总要做一些奇奇怪怪的步骤才可以看到熟悉的控制台页面。
不管怎么说,有需求,总会有对应的办法来解决的。
首先,我们来看一下
普通手机浏览器调试步骤(Chrome)
这里引用 Chrome 官方
Remote debug Android devices - Chrome Developers
Remote debug live content on an Android device from your Windows, Mac, or Linux computer. This tutorial teaches you how to:
- Set up your Android device for remote debugging, and discover it from your development machine.
- Inspect and debug live content on your Android device from your development machine.
- Screencast content from your Android device onto a DevTools instance on your development machine.
Step 1: Discover your Android device
第一步,发现设备
The workflow below works for most users. See Troubleshooting: DevTools is not detecting the Android device for more help.
Open the Developer Options screen on your Android. See Configure On-Device Developer Options.
在手机上面打开
开发者调试功能(自行百度)(大多数手机为连点设备号即可进入)Select Enable USB Debugging.
在
开发者调试功能内,选择启用 USB 调试On your development machine, open Chrome.
使用数据线连接电脑,并在电脑上打开
Chrome(不出意外并且首次连接,会弹窗提示是否运行此计算机调试,选择允许即可)
Go to
chrome://inspect#devices.在上文打开的
Chrome中,打开地址 :chrome://inspect#devices若
Edge浏览器,可打开edge://inspect/#devicesMake sure that the Discover USB devices checkbox is enabled.
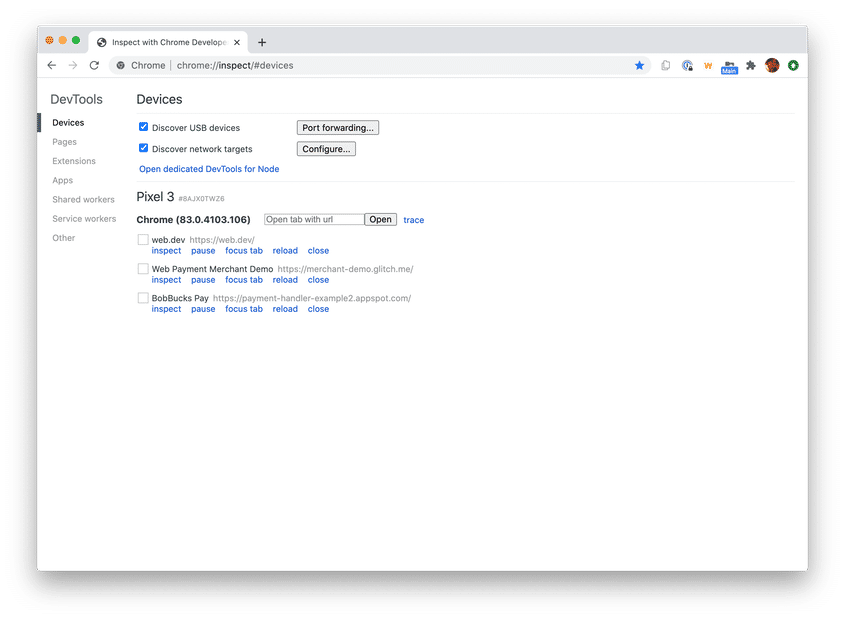
勾选
Discover USB devices复选框(如下图)确保你的手机已经成功连接了电脑,等待一会,你的设备会出现在上一步打开的页面。
Connect your Android device directly to your development machine using a USB cable. Your Android device may ask you to confirm that you trust this computer. The first time you do this, you usually see that DevTools has detected an offline device. If you see the model name of your Android device, then DevTools has successfully established the connection to your device. Continue to Step 2.
使用 USB 电缆将您的 Android 设备直接连接到您的开发机器。
您的 Android 设备可能会要求您确认您信任这台计算机。
第一次执行此操作时,您通常会看到 DevTools 检测到脱机设备。
如果您看到 Android 设备的型号名称,则 DevTools 已成功建立与您设备的连接。 继续第 2 步。
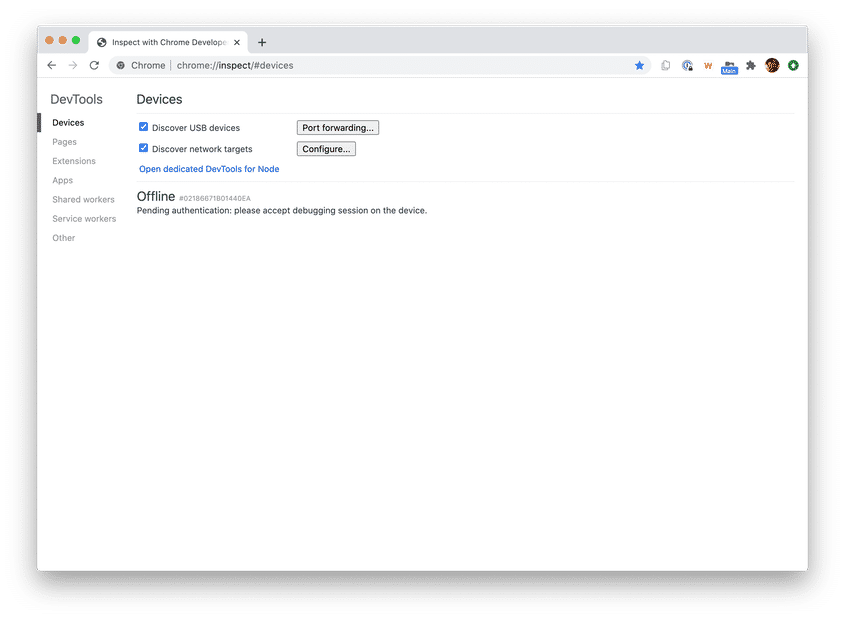
If your device is showing up as Offline, accept the Allow USB Debugging permission prompt on your Android device.
如果您的设备显示为离线,请在您的 Android 设备上接受允许 USB 调试权限提示。(如下图)
常见报错见 Remote debug Android devices - Chrome Developers
值得注意的是,连接模式改成
PTP也许会起作用。
Step 2: Debug content on your Android device from your development machine
在你的 Android 设备调试内容
Open Chrome on your Android device.
在你的手机上打开
ChromeIn the
chrome://inspect/#devices, you see your Android device’s model name, followed by its serial number. Below that, you can see the version of Chrome that’s running on the device, with the version number in parentheses. Each open Chrome tab gets its own section. You can interact with that tab from this section. If there are any apps using WebView, you see a section for each of those apps, too. In Figure 5 there are no tabs or WebViews open.打开
chrome://inspect/#devices,等待一会儿就看见设备了。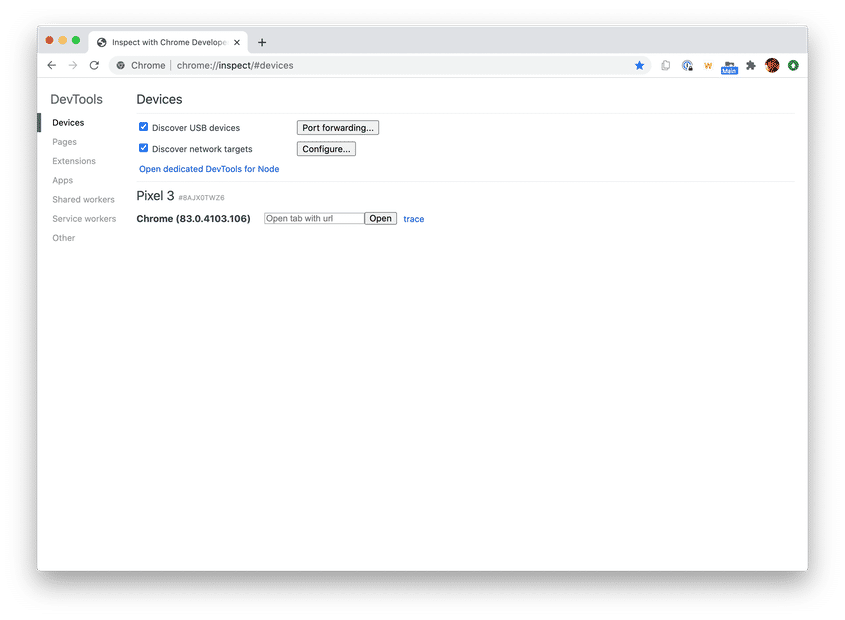
In the Open tab with url text box, enter a URL and then click Open. The page opens in a new tab on your Android device.
Click Inspect next to the URL that you just opened. A new DevTools instance opens. The version of Chrome running on your Android device determines the version of DevTools that opens on your development machine. So, if your Android device is running a very old version of Chrome, the DevTools instance may look very different than what you’re used to.
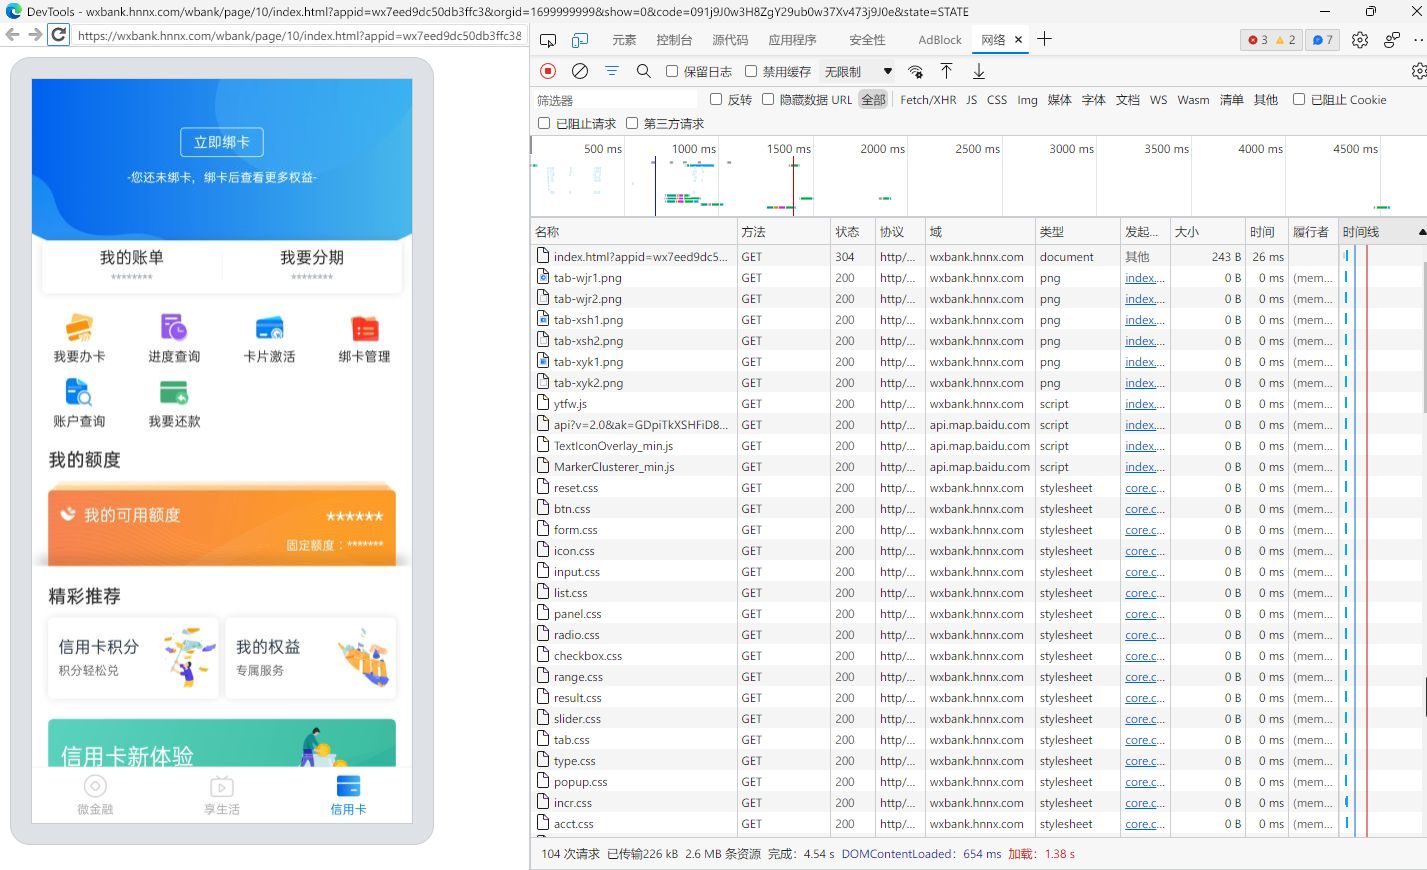
点击 Inspect,然后开始调试就行了。
微信内置浏览器调试步骤
参考链接:x5核心无法打开,安装内核提示“内核下载失败115→115”,请问有相同情况吗? | 微信开放社区 (qq.com)
- 在手机微信内部打开 (此为移动端微信内置域名)
成功打开后即开启微信的远程调试功能
之后就和上文那个
Chrome浏览器一样的步骤了
- 开始享用吧 : )
- 本教程来源官方,经过测试微信调试页的出现时间比普通浏览器要长,所以耐心等待
- 有问题请在评论区提出。
此篇教程已经得到验证并且被
方佬录入教程。(我是在直播间传播的这个方法,后知后觉发现大家都不会?)
注意(提一下 X5 内核)
由于微信的浏览器更换了引擎,所以之前之前的方案不可用了
之前的方案(X5内核):
所以本教程还是算很新的,毕竟微信这几个月才刚换的内核,我在网上也没有搜到相关的帖子。
故在此写教程供大家参考。